
1999 Mar 15 – 2000 Jun 16
| Date | Event Type | Fatalities | VEI (Explosivity Index) | Level | Event Remarks | Reference |
| 1999 Mar 15 – 2000 Jun 16 | Explosion, Ash, Earthquakes, Audible Sounds | 1 people died | 1 | – | Incadescent material around the crate, Ash reached 200 m abive the crater | [1], [3], [5] |
1998 Jul 4
| Date | Event Type | Fatalities | VEI (Explosivity Index) | Level | Event Remarks | Reference |
| 1998 Jul 4 | Explosion, Seismicity | – | 1 | – | – | [1] |
1994 Aug 7 – 1994 Aug 14
| Date | Event Type | Fatalities | VEI (Explosivity Index) | Level | Event Remarks | Reference |
| 1994 Aug 7 – 1994 Aug 14 | Explosion, Ash, Lava flow, Seismicity | – | 1 | – | Ash drifted to west area, Ash reached 20-300 m above the summit | [1], [3] |
1974 Mar 12 – 1974 Apr 16
| Date | Event Type | Fatalities | VEI (Explosivity Index) | Level | Event Remarks | Reference |
| 1974 Mar 12 – 1974 Apr 16 | Explosion, Lava flow | – | 2 | – | Lava drifted to West area on yehmapeh | [1-3] |
1972 Jan 19 – 1972 Mar 16
| Date | Event Type | Fatalities | VEI (Explosivity Index) | Level | Event Remarks | Reference |
| 1972 Jan 19 – 1972 Mar 16 | Explosion, Ash | – | 2 | – | Lava drifted to West area on yehmapeh | [1] |
1974 Mar 11 – 1971 Aug 25
| Date | Event Type | Fatalities | VEI (Explosivity Index) | Level | Event Remarks | Reference |
| 1974 Mar 11 – 1971 Aug 25 | Explosion, Ash | – | 1 | – | – | [1] |
1970 Jan 5 – 1970 Jan 15
| Date | Event Type | Fatalities | VEI (Explosivity Index) | Level | Event Remarks | Reference |
| 1970 Jan 5 – 1970 Jan 15 | Explosion, Ash, Audible sounds | – | 1 | – | Ash drifted to Kintamani Area | [1],[3] |
1968 Jan 23 – 1968 Feb 15
| Date | Event Type | Fatalities | VEI (Explosivity Index) | Level | Event Remarks | Reference |
| 1968 Jan 23 – 1968 Feb 15 | Explosion, Lava flow, Ash, Audible sounds | – | 2 | – | Lava drifted to South Area | [1-3] |
1966 Apr 28
| Date | Event Type | Fatalities | VEI (Explosivity Index) | Level | Event Remarks | Reference |
| 1966 Apr 28 | Explosion, Ash, Crater | – | 1 | – | – | [1] |
1965 Aug 18 – 1965 Dec 16
| Date | Event Type | Fatalities | VEI (Explosivity Index) | Level | Event Remarks | Reference |
| 1968 Jan 23 – 1968 Feb 15 | Explosion, Lava flow, Ash, Property damage | – | 1 | – | – | [1] |
1963 Sep 5 – 1964 May 10
| Date | Event Type | Fatalities | VEI (Explosivity Index) | Level | Event Remarks | Reference |
| 1963 Sep 5 – 1964 May 10 | Explosion, Lava flow, Ash, Property damage, Lapilli, Lava fountains, Bombs | – | 2 | – | Lava covered the West Area and South East, West area covered by lava around 1.280.230 m2 and 4.322.700 m2 | [1-4] |
1926 Aug 2 – 1926 Sep 21
| Date | Event Type | Fatalities | VEI (Explosivity Index) | Level | Event Remarks | Reference |
| 1926 Aug 2 – 1926 Sep 21 | Explosion, Lava flow, Ash, Property damage, Lapilli, Lava lake, Bombs, Earthquakes | – | 2 | – | Lava covered Batur Village, Lava with volume arround 21×106 m3 | [1-3] |
1925 Jan 5
| Date | Event Type | Fatalities | VEI (Explosivity Index) | Level | Event Remarks | Reference |
| 1925 Jan 5 | Explosion, Ash | – | 2 | – | Ash and Lava Incadescent | [1,3] |
1924 Mar
| Date | Event Type | Fatalities | VEI (Explosivity Index) | Level | Event Remarks | Reference |
| 1924 Mar | Explosion, Ash, Bombs | – | 2 | – | – | [1] |
1923
| Date | Event Type | Fatalities | VEI (Explosivity Index) | Level | Event Remarks | Reference |
| 1923 | Explosion, Ash, Bombs | – | 2 | – | – | [1] |
1922 Aug 30
| Date | Event Type | Fatalities | VEI (Explosivity Index) | Level | Event Remarks | Reference |
| 1922 Aug 30 | Explosion | – | 2 | – | – | [1] |
1921 Jan 29 – 1921 Apr 17
1905
1904
| Date | Event Type | Fatalities | VEI (Explosivity Index) | Level | Event Remarks | Reference |
| 1904 | Explosion, Lava flow, Cinder cone | – | 2 | – | Lava flow in West Area | [1-3] |
1897
| Date | Event Type | Fatalities | VEI (Explosivity Index) | Level | Event Remarks | Reference |
| 1897 | Explosion | – | 2 | – | – | [1] |
1888 May 30 – 1888 May 31
1854 Apr 28
| Date | Event Type | Fatalities | VEI (Explosivity Index) | Level | Event Remarks | Reference |
| 1854 Apr 28 | Explosion | – | 2 | – | – | [1] |
1849
1821 Mar 16
| Date | Event Type | Fatalities | VEI (Explosivity Index) | Level | Event Remarks | Reference |
| 1821 Mar 16 | Explosion | – | 2 | – | – | [1] |
1804
| Date | Event Type | Fatalities | VEI (Explosivity Index) | Level | Event Remarks | Reference |
| 1804 | Explosion | – | 2 | – | – | [1] |
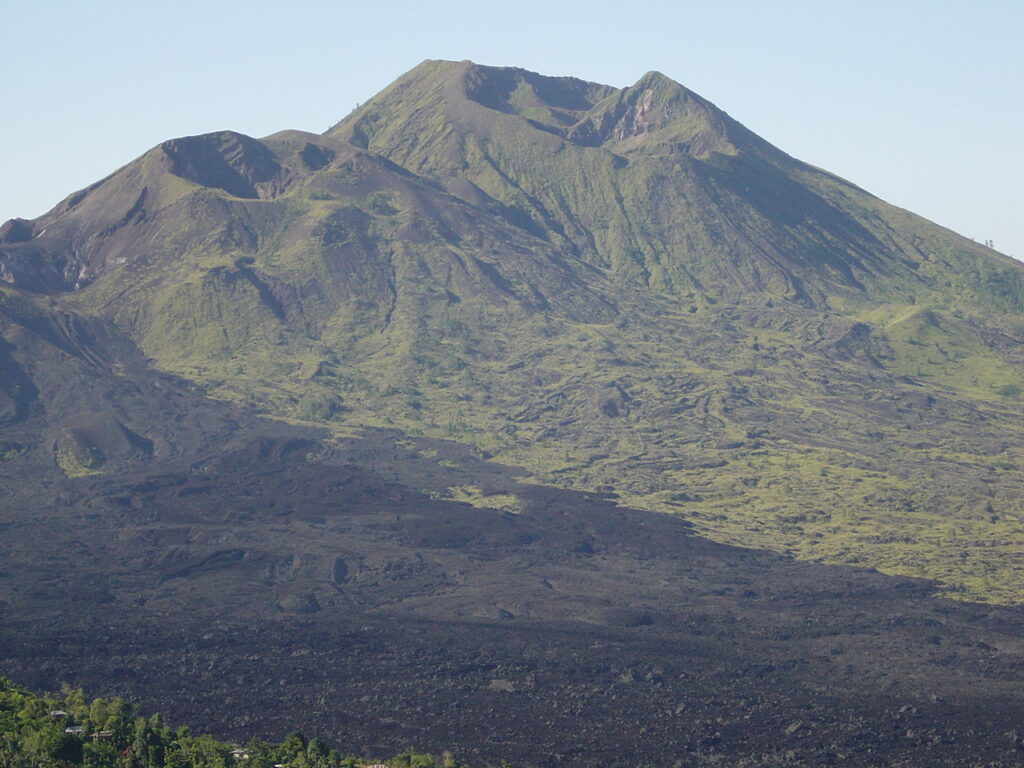
The morphology of Mount Batur is closely related to the volcanic evolution that occurred and some are influenced by structural land conditions. The natural landscape of Mount Batur is composed of basalt andesite lava deposits. Lake Batur is one of the effects of the collapse that occurred in the Batur Caldera. This morphology was formed as a result of progressive volcanic activity that carried the rock inside until it finally collapsed into a caldera basin. After this subsidence occurred, several conditions such as Mount Abang were formed. Mount Abang, is part of the body of Mount Batur that did not collapse. In some places, the land is filled with lava covered by pyroclastic deposits [6].
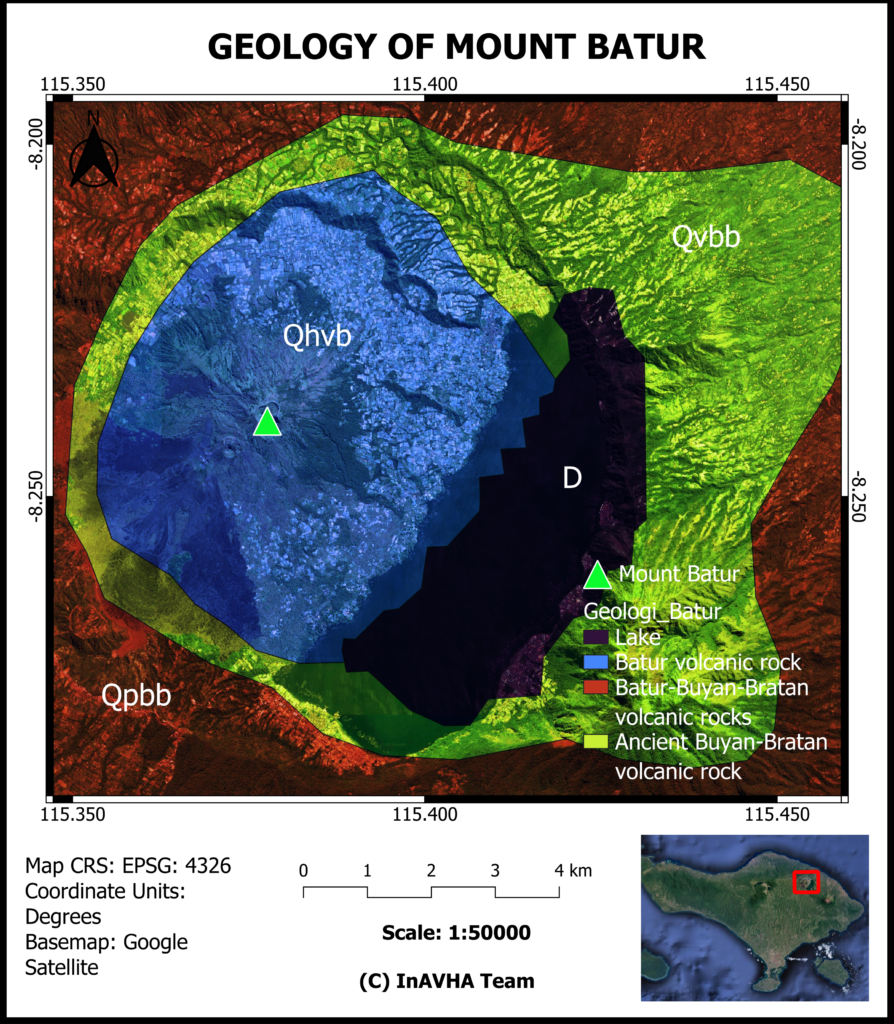
The distribution of rocks produced from Mount Batur can be divided into 5 periods, namely, period I Tertiary period, period II Quaternary period (pre-caldera), period III caldera formation period I, period IV caldera formation period II, and period V post-caldera period. The oldest rocks exposed are the pyroclastic flow deposits of Bukit Jangkrik, these rocks are exposed in the southern part. The next rock that is exposed is the Cempaga Lava which is composed of olivine basalt, this rock is exposed slightly in the south. The younger rock is Tejakulak Lava which is exposed in the north, composed of porphyritic olivine basalt, bright grey, phenocrysts (about 40%) characterised by large euhedral – subhedral olivine with subhedral plagioclase (less than 2 mm) [7].
The caldera of Mount Batur is enclosed from all directions, and is one of the largest and most beautiful calderas in the world [8]. The caldera rim ranges in height from 1267 m to 2152 m (Mount Abang Peak). Inside Caldera I, Caldera II is formed in a circular shape with a centre line of approximately 7 km. The base of Kaldera II is located between 120 – 300 m lower than Undak Kintamani (base of Kaldera I). Inside the caldera is a crescent-shaped lake. According to Van Bemmelen (1949), the lake is thought to have formed simultaneously with the formation of Kaldera II.
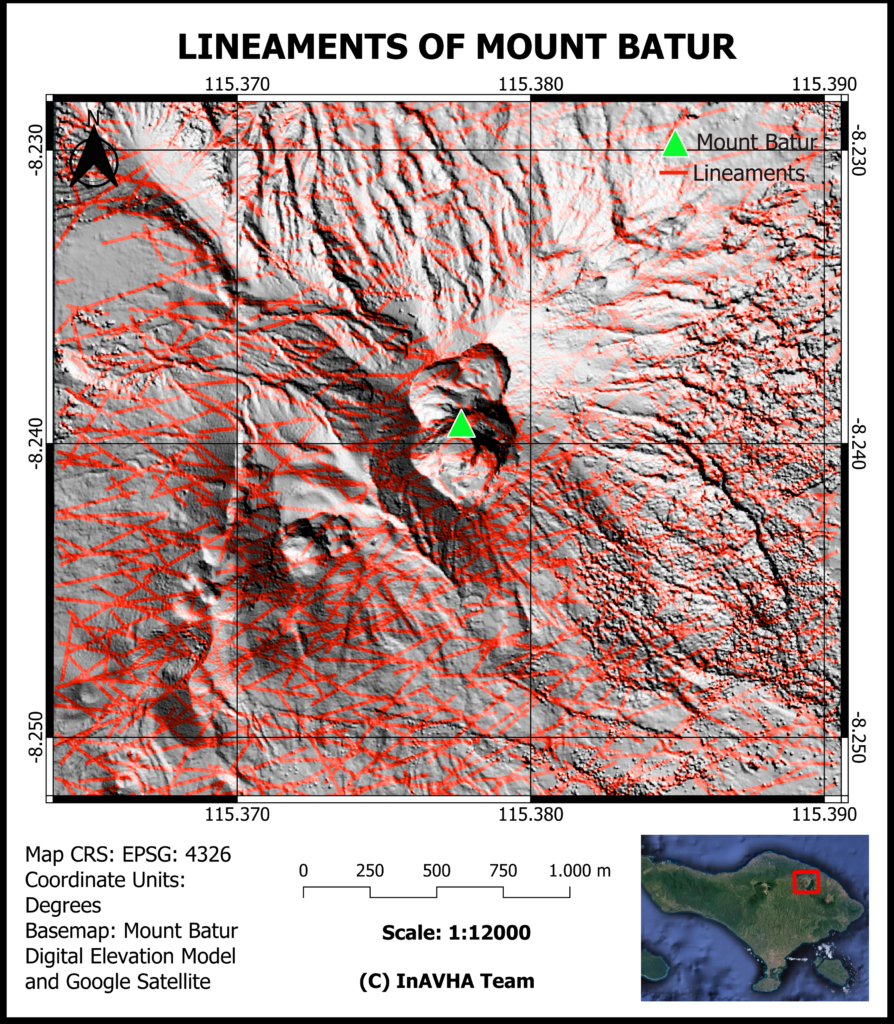 Lineaments Of Mount Batur
Land Surface Temperature
Land surface temperatures (LST) reflect temperatures beneath the earth in a volcanic area. Volcanoes offer a subterranean heat source that is funneled by steaming vents, geysers, hot springs, lava flows, lava domes, and so on to generate thermal phenomena on the land surface, and satellite sensors from space may measure land surface temperatures [9, 10]. To identify the LST values, thermal infrared (TIR) data from the Landsat 8 satellite was utilized. The spatial analysis conducted was an observation of LST values in the crater area and the surrounding Mount Batur region from 2021 to 2024 with each year was a cumulative.
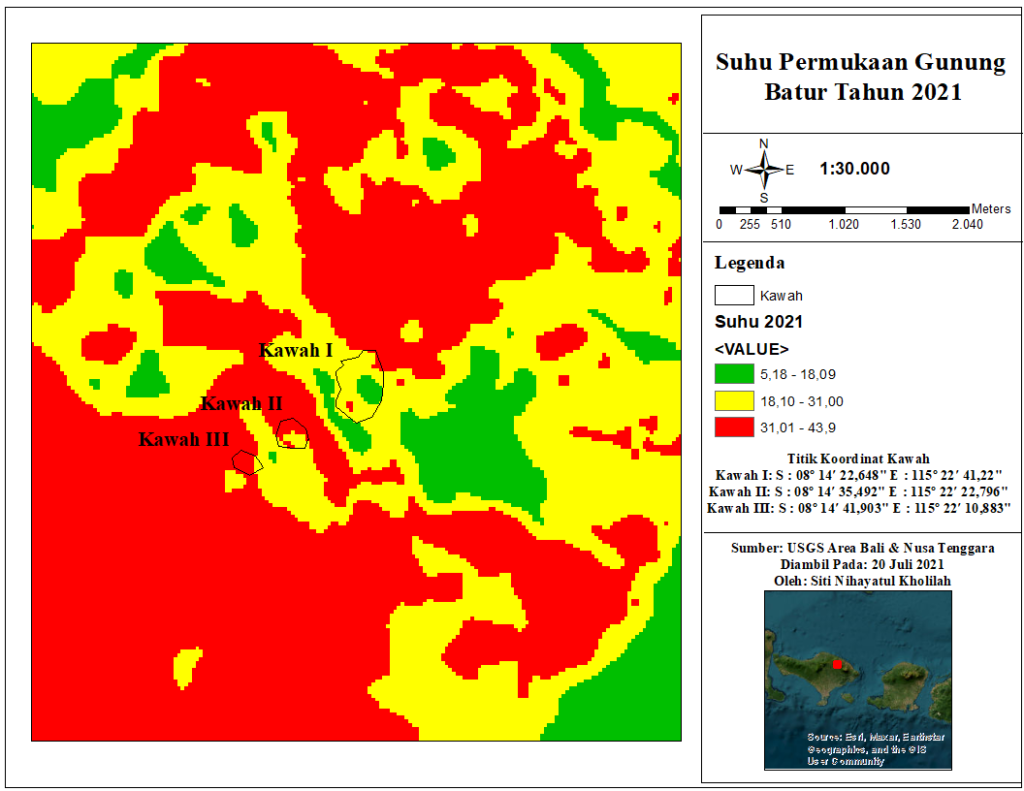
Cumulative land surface temperature in 2021
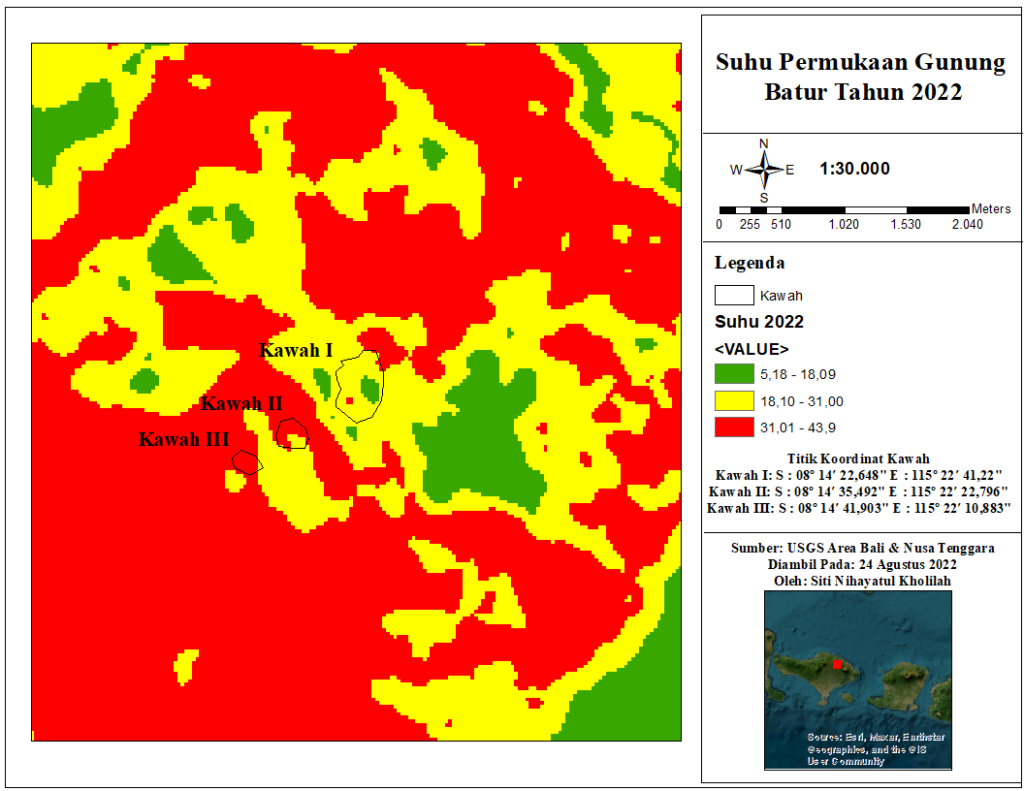
Cumulative land surface temperature in 2022
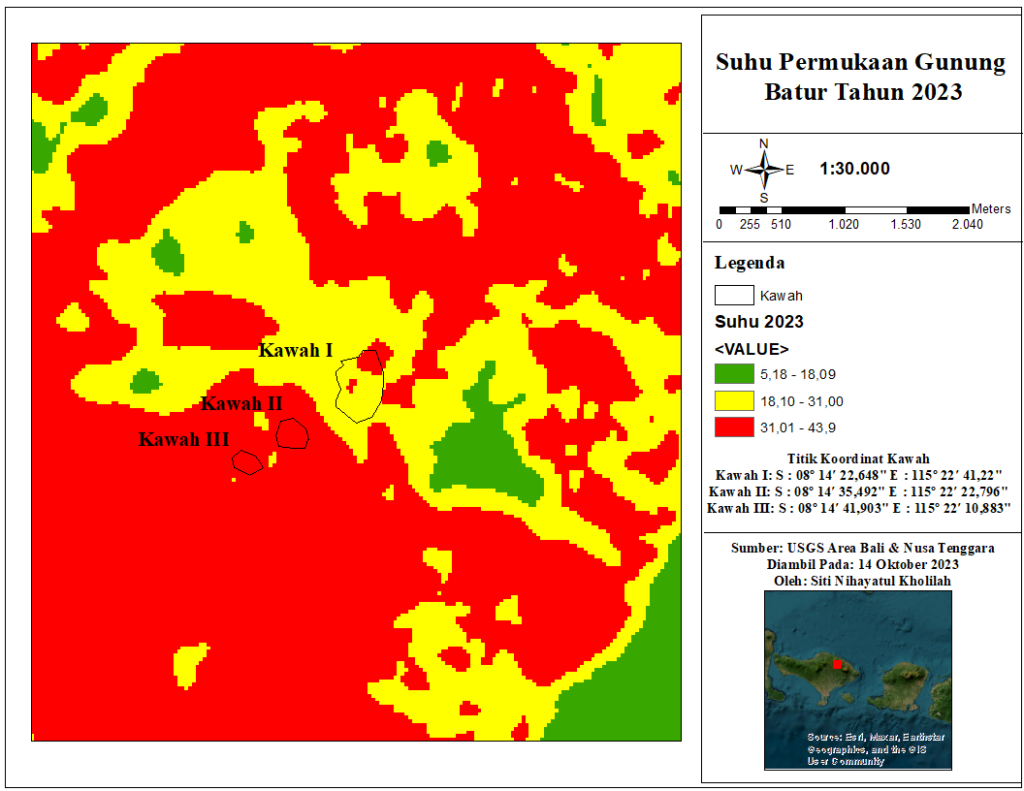
Cumulative land surface temperature in 2023
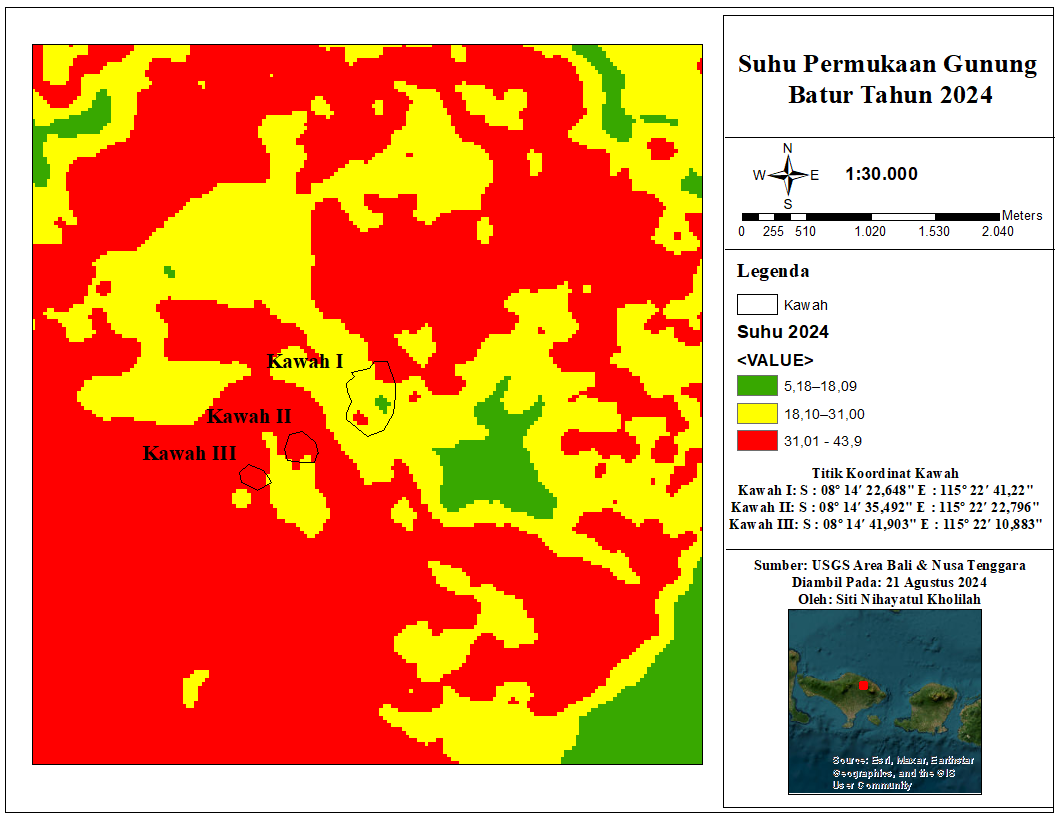
Cumulative land surface temperature in 2024
[1] Volcano.si.edu
[2] Agastya, I. B. O., Diwyastra, P. D., Hespiantoro, S., & Ariana, D. (2023). SEBARAN DAN PROSES GEOLOGI PEMBENTUKAN LAVA TUBE KESAKSAK DI BATUR UNESCO GLOBAL GEOPARK. JURNAL GEOMINERBA (JURNAL GEOLOGI, MINERAL DAN BATUBARA), 8(1), 44-61.
[3] vsi.esdm.go.id
[4] Hidayati, S., & Sulaeman, C. (2013). Magma Supply System at Batur Volcano Inferred from Volcano-Tectonic Earthquakes and Their Focal Mechanism. Indonesian Journal on Geoscience, 8(2), 97-105.
[5] Arif, A. S. (2016). Mount Batur Calderas as a Sacred Landscape in Bali. In 5th ACLA: Symposium on Sacred Sites, Cultural Landscape & Harmonizing the World of Asia.
[6] Davis, W. M. 1921. “Review : Volcanoes of Eastern Bali Reviewed Work ( s ): DeVulkanen Goenoeng Batoer En Goenoeng Agoeng Op Bali by G . L . L .Kemmerling Review by : W . M . Davis.” 11(3):459–60
[7] Sutawidjaja, I. S., Chaniago, R., Kamal, S., and Modjo, W. S. (1992). Geological map of Batur caldera, Bali, Indonesia. Volcanological Survey of Indonesia, Bandung
[8] Bemmelen Van, R.W. 1949. The Geology of Indonesia. Martinus Nyhoff, Netherland: The Haque.
[9] Caputo, T. et al. Surface temperature multiscale monitoring by thermal infrared satellite and ground images at Campi Flegrei
volcanic area (Italy). Remote Sens. 11(9), 1007 (2019).
[10] Chan, H.-P. & Konstantinou, K. I. Multiscale and multitemporal surface temperature monitoring by satellite thermal infrared
imagery at Mayon Volcano, Philippines. J. Volcanol. Geotherm. Res. 401, 106976 (2020).